User retention is the share of users who continue to use an app after their first visit, tracked by cohort at Day 1, 7, and 30.
What is User Retention?
User retention is typically measured by cohort rather than in aggregate, since grouping users by the week or month they first signed up isolates the effect of a specific product change from shifts in the overall user base. Teams commonly report retention at fixed checkpoints, most often Day 1, Day 7, and Day 30, though some also track Day 90 or annual retention for subscription products where the relevant habit forms more slowly. A related but distinct concept is churn rate, which measures the share of users who stop returning rather than the share who do; the two are complementary views of the same underlying behavior. One common caveat is that retention curves eventually flatten into a stable base of long-term users, so teams watch for that flattening point as a sign the product has found a durable audience rather than continuing to decline toward zero.
Why User Retention Matters
User retention tells a product team whether the app has become part of a user's routine or was tried once and forgotten. Acquisition brings people in; retention decides whether that spend produced anything durable. For a growth team, the retention curve is the fastest way to evaluate a change: if a new onboarding flow or a community feature lifts Day-7 retention for the cohort that received it, the effect is visible within a week rather than a quarter. For a finance team, retention drives lifetime value, since every extra month a user stays is another month of subscription revenue, purchases, or attention.
How to Calculate User Retention
Retention is measured by cohort. Take every user who first used the app in a given period, then count how many of them were active again on a later day.
Day-N retention = (users from the cohort active on Day N / users in the cohort) x 100
| Checkpoint | What it reveals | Typical question it answers |
|---|---|---|
| Day 1 | Whether the first session delivered value | Did onboarding work? |
| Day 7 | Whether a habit is starting to form | Did users find a reason to return in week one? |
| Day 30 | Whether the app is part of the routine | Is this user likely to stay long term? |
| Retention curve | The shape across all days | Does the curve flatten (stable base) or fall to zero? |
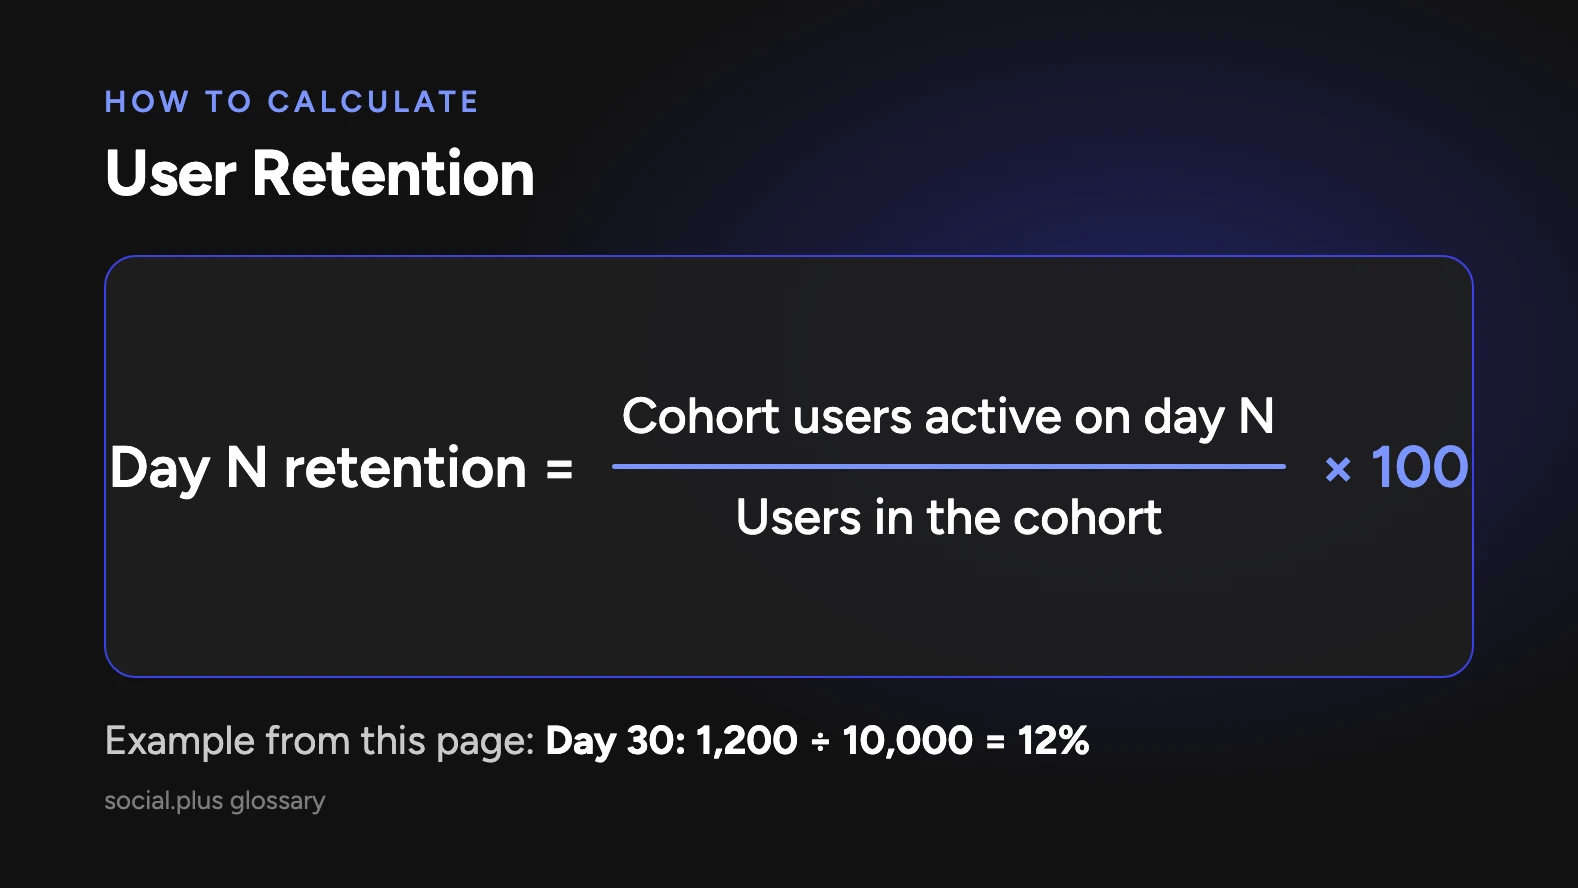
Worked example: 10,000 users install an app in the first week of March. On Day 1, 4,000 of them return (a 40% retention rate). On Day 7, 2,000 return (20%). On Day 30, 1,200 return (12%). A month later the team ships group chat and measures the April cohort: Day 30 retention rises to 1,560 out of 10,000, or 15.6%. That is a 30% relative lift in retained users from the same acquisition spend.
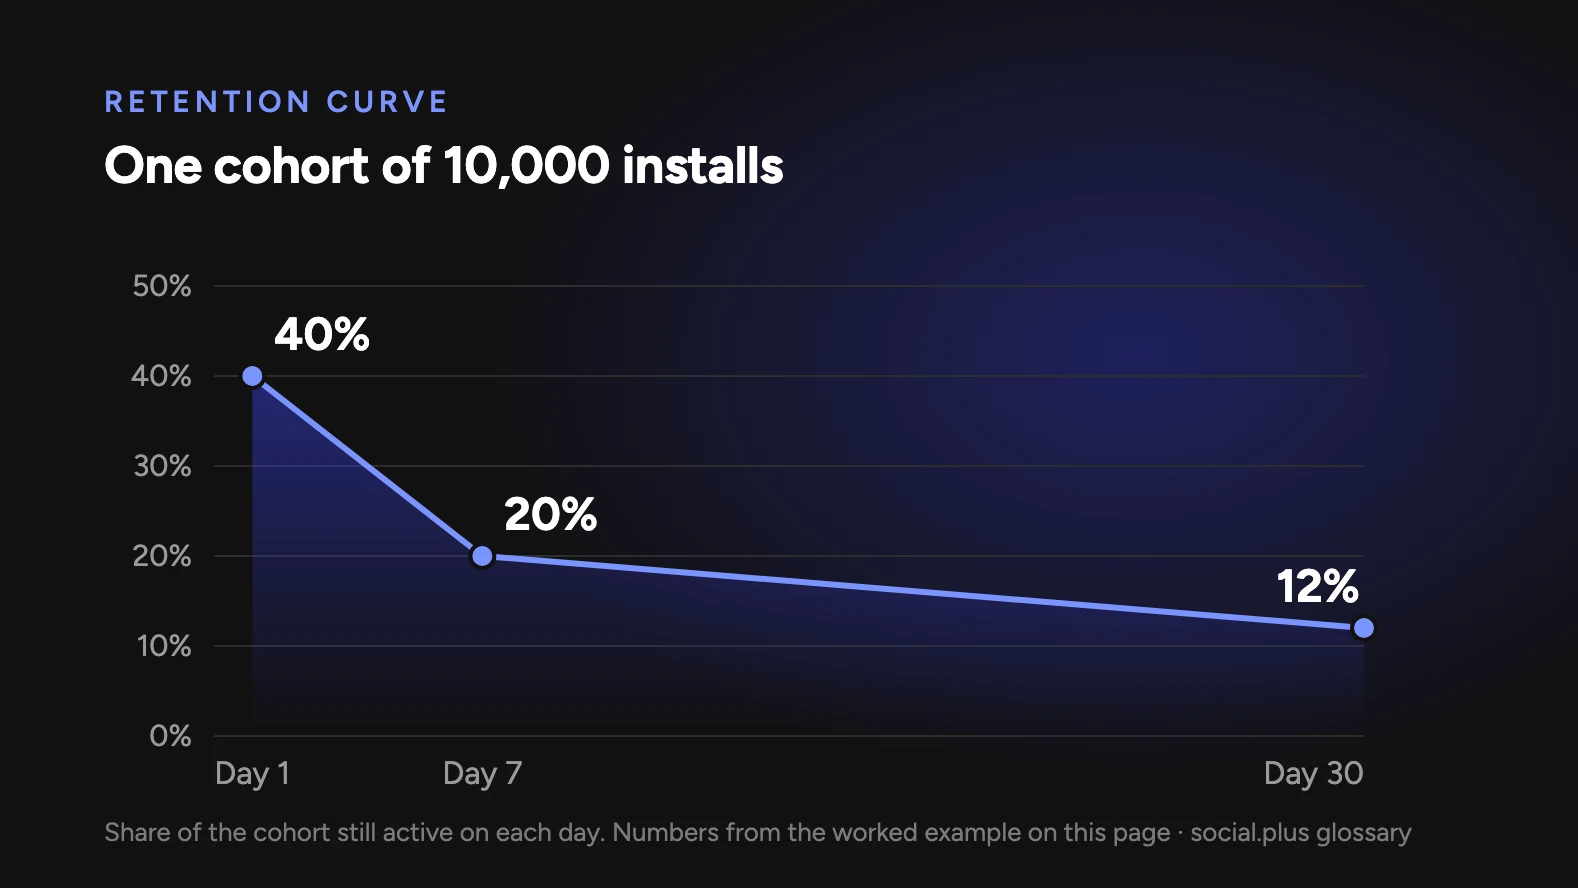
The shape of the curve matters as much as any single number. A curve that flattens means a stable base of retained users; one that keeps falling means the app has not yet found its habit loop.
User Retention and social.plus
User retention is the outcome social.plus engagement infrastructure is built to improve. Users who follow people, belong to groups, and take part in conversations have reasons to return that do not depend on the brand pushing a new promotion. Across its customer base, social.plus reports retention lifts of 10 to 35% for apps that add social features such as feeds, groups, chat, and live streaming. Noom, with more than 45M users, runs community features where peer support gives users a reason to come back beyond the core program, and Harley-Davidson's community of more than 1M members keeps owners engaged between purchases. Retention gains of that kind depend on implementation and ongoing community effort, not on the integration alone.
Key Takeaways
- User retention is the share of a cohort still active at Day 1, 7, and 30 after first use.
- It measures user behavior over time and determines whether acquisition spend produces durable value.
- The shape of the retention curve, especially whether it flattens, matters as much as any single checkpoint.
- Social features give users reasons to return, and social.plus reports retention lifts of 10 to 35% for apps that add them.