App retention is the percentage of users who installed an app and are still active after a set period, typically day 1, day 7, or day 30.
What is App Retention?
App retention is typically calculated per install cohort, meaning the group of users who first opened the app on the same day, rather than across the whole user base at once, so that a single bad week of installs does not distort the trend. Teams commonly track it at three checkpoints: day 1 for onboarding, day 7 for whether the app earns a spot in the weekly routine, and day 30 for whether it has become a habit, though some teams add day 90 or a custom checkpoint for longer-cycle apps. One frequent variant is the difference between classic retention, which counts only a return exactly on day N, and rolling retention, which counts any return on or after day N and typically produces a higher number. App retention describes the product as a whole; it is a different measure from user retention, which looks at how specific segments or individual users behave rather than the install base in aggregate.
Why App Retention Matters
App retention decides whether acquisition spend compounds or leaks. Every user who churns in the first week is a marketing dollar that produced no lasting value, so a small improvement in early retention changes the return on the entire acquisition budget.
For product teams, the practical benefit of tracking app retention by cohort is that it isolates the effect of product changes. If the cohort that installed after a release retains better at day 7 than the cohort before it, the release worked. Retention curves also help finance teams estimate lifetime value and set a ceiling on what the team can pay per install.
How to Calculate App Retention
App retention is calculated per install cohort. Take the users who first opened the app on a given day, then measure what share of them returned on or by day N. The day N convention matters: classic retention counts a return exactly on day N, while rolling retention counts any return on or after day N.
| Checkpoint | What it shows | Typical question it answers |
|---|---|---|
| Day 1 retention | Whether onboarding and first-session value land | Do users understand the app on first use? |
| Day 7 retention | Whether the app earns a place in the weekly routine | Is there a reason to return without a prompt? |
| Day 30 retention | Whether the app has become a habit | Has the user built something they would lose by leaving? |
| Retention curve | The full shape across all days | Where does the curve flatten, and at what level? |
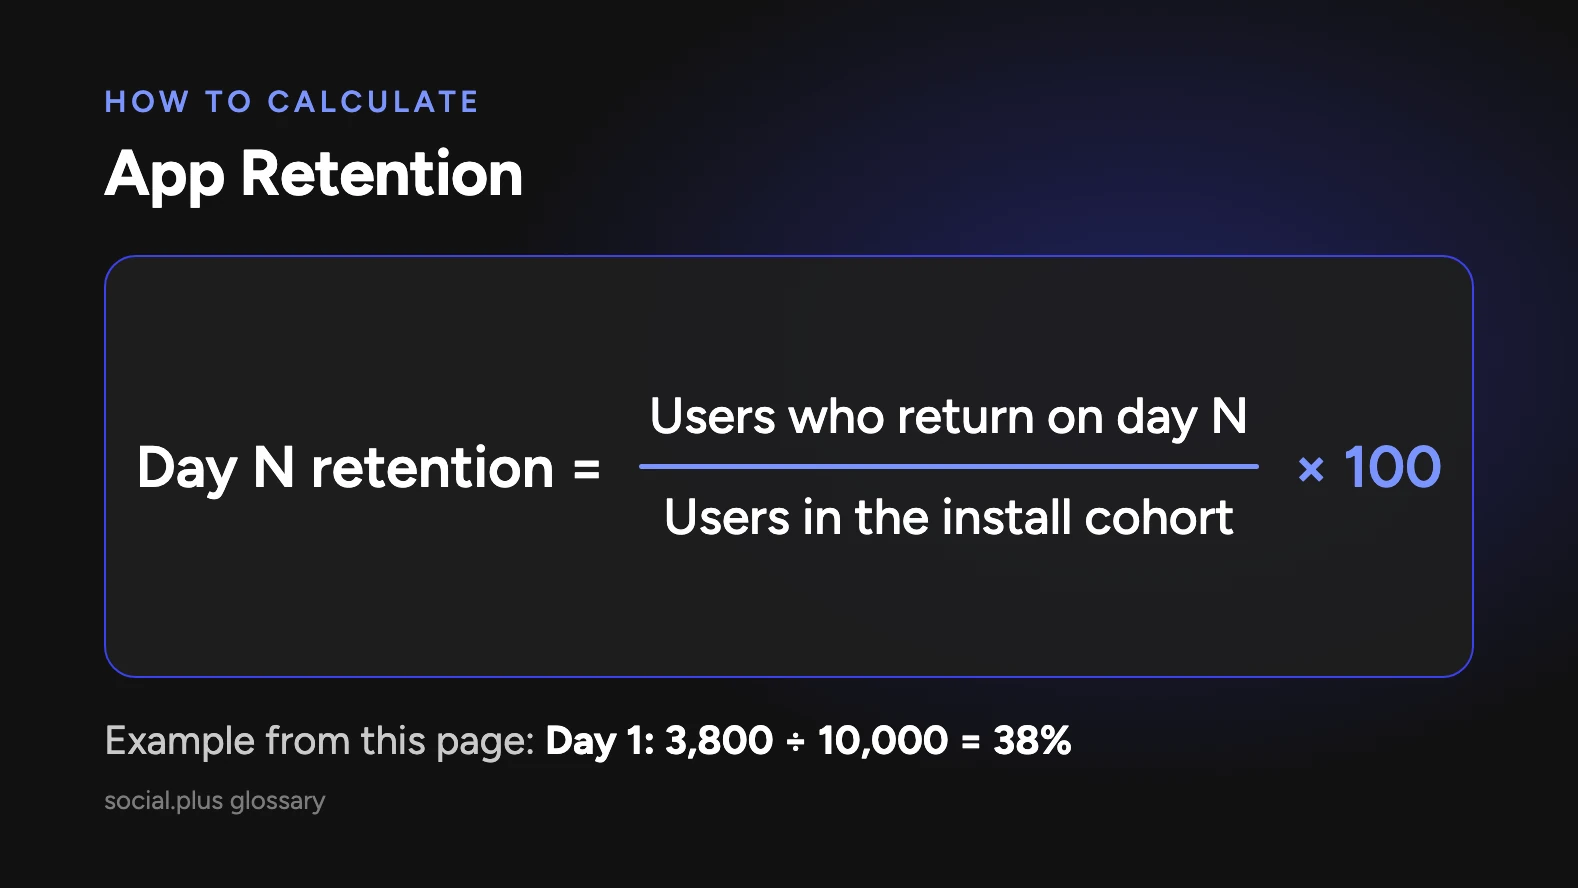
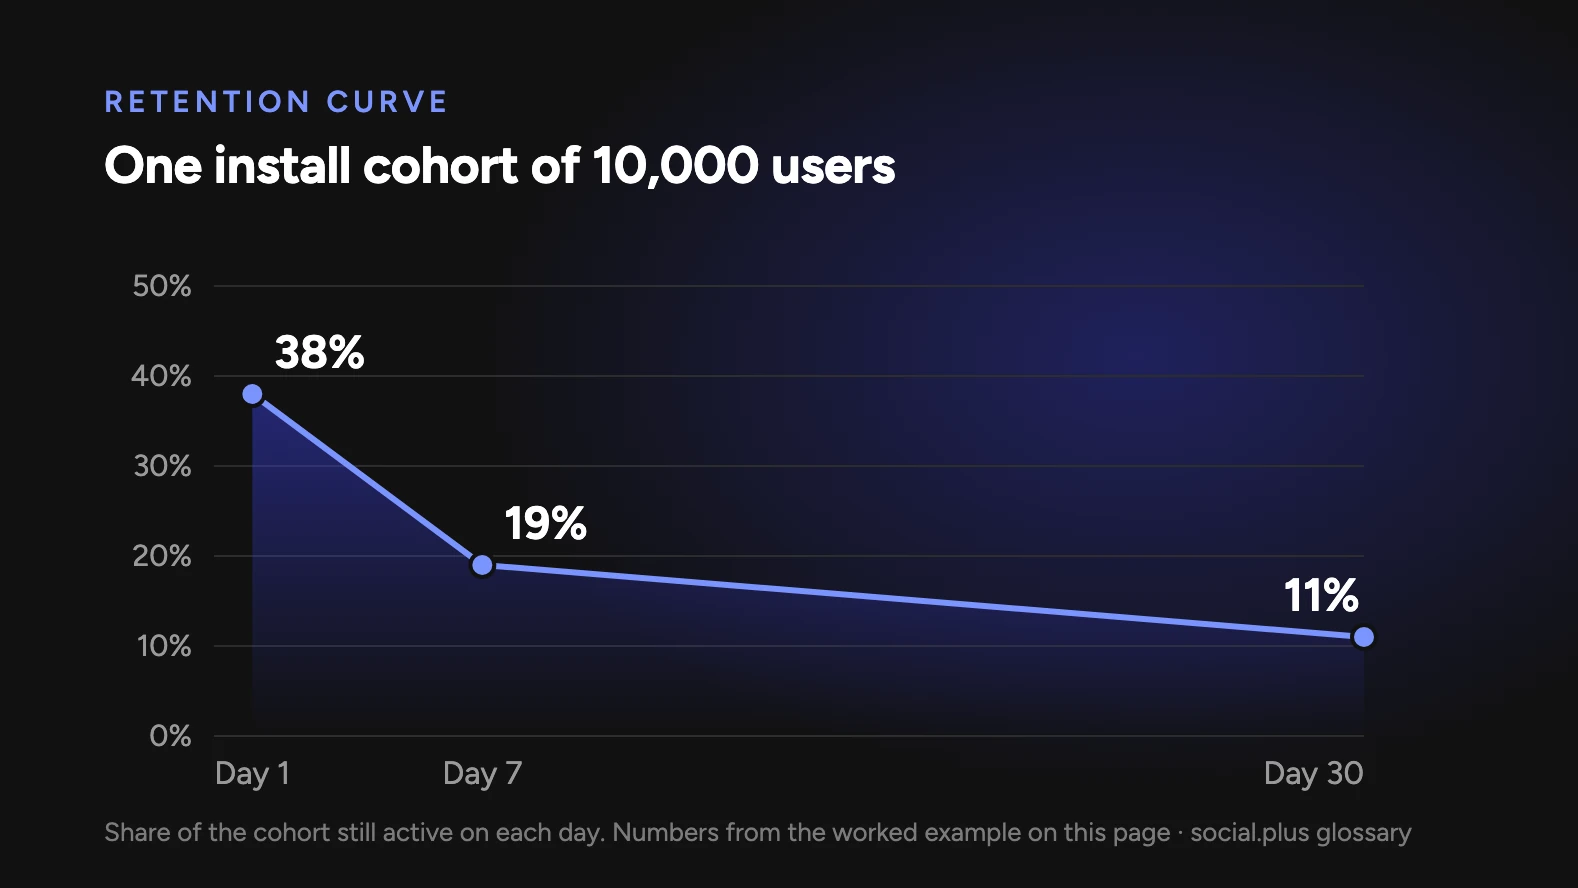
A worked example: 10,000 users install an app on 1 March. On 2 March, 3,800 of them open the app, so the day 1 retention rate is 38 percent. On 8 March, 1,900 open it, so day 7 retention is 19 percent. On 31 March, 1,100 open it, so day 30 retention is 11 percent. If the next cohort of 10,000 installs, after a new onboarding flow, shows day 7 retention of 23 percent, that is 400 additional retained users from the same acquisition spend.
App retention is distinct from user retention. App retention looks at the app as a product: the install-to-return rate across the whole user base. User retention looks at individual user behavior and segments, such as whether users who joined a group retain better than users who did not. The first tells the team how the product performs; the second tells the team why.
App Retention and social.plus
social.plus provides engagement infrastructure that gives users reasons to return, which is what moves app retention at day 7 and day 30. Feeds, groups, in-app chat, live streaming, stories, and profiles create relationships and content inside the app that a user would lose by leaving. Brands using social.plus have reported retention lifts of 10 to 35 percent alongside engagement rates of 20 to 50 percent. Noom, which serves more than 45 million users, and Smart Fit, which grew its community 60 percent month over month, are among the apps building on this infrastructure.
Key Takeaways
- App retention is the share of an install cohort still using the app at day 1, day 7, and day 30.
- Cohort-based measurement isolates the effect of product changes on retention.
- Small gains in early retention improve the return on the entire acquisition budget.
- App retention measures the product as a whole; user retention explains the behavior behind it.