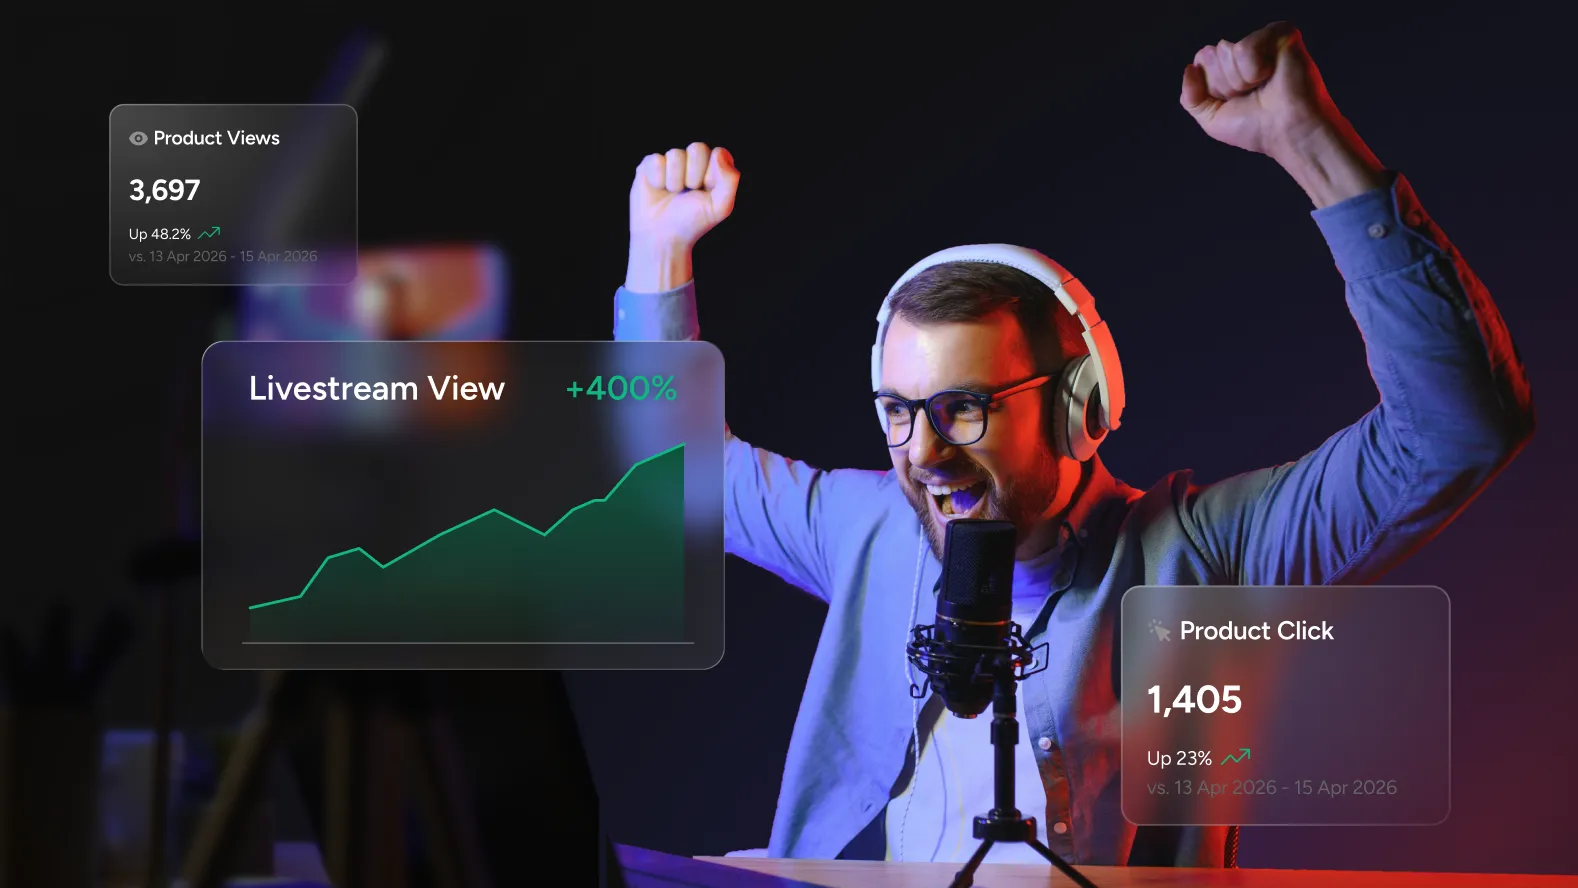
Product impressions and CTA clicks are the two data points that livestream product tagging generates. On the surface, they look like the same metrics that post tagging produces. In practice, they tell a different story, because the context in which a viewer encounters a product during a live stream is fundamentally different from the context of a static post.
In a post, a member is browsing. They have time and attention to consider what they see. In a live stream, a viewer is watching something happen in real time. Their attention is on the host, the content, the energy of the moment. A product that appears during that experience is competing with a live event for their focus, which means the signals that impressions and clicks produce during a stream carry different meaning than the same numbers in a post context.
This guide covers how to read livestream product data accurately, what the patterns in that data reveal about your product placement strategy, and how live and replay analytics differ in ways that matter for how you act on them.
The Two Metrics and What They Actually Measure
Total product impressions
An impression is recorded each time a tagged product is displayed to a viewer during the stream. Every viewer who sees your product overlay or product shelf during the broadcast contributes to this number.
Impressions during a live stream are influenced by factors that do not apply to static content. When you pin a product, every active viewer in the room at that moment generates an impression simultaneously. That means impression spikes in your data correspond directly to the moments you activated a pin, not to organic discovery behavior. This is important context when reading the numbers: a high impression count does not necessarily mean sustained interest. It may simply reflect how many people were watching when you surfaced a product.
The more useful question impressions answer in a live context is: at what point in the stream were viewers most present? Plotting impressions over the duration of the broadcast shows you the shape of your audience across the stream, which segments held the most viewers and which saw drop-off. When you overlay your product pin moments on that shape, you can see immediately whether you were surfacing products to a full room or a declining one.
Total CTA and product card clicks
A click is recorded when a viewer actively taps a product tag, product card, or CTA button. In a live stream context, this is a significantly higher signal than it is in a post. A viewer who is actively watching something happen in real time and still chooses to tap through to a product has done something deliberate. They broke their attention from the stream to engage with the product. That is a strong indicator of genuine interest.
Low click numbers are not automatically a problem in this context. A viewer who sees a pinned product while deeply engaged in a live demonstration may register the product, intend to come back to it, and engage during the replay or through other means. The live stream click is the highest-intent moment. It is not the only moment that counts.
- Why live click rates differ from post click rates: A viewer tapping a product during a live stream is choosing to pause their attention on a live event. That requires more deliberate intent than tapping a tag on a static post. Engagement rates on live content are roughly 10% higher than pre-recorded equivalents overall, but that elevated engagement is directed at the content. Product clicks sit alongside that engagement, not automatically within it. Benchmarking live product clicks against post product clicks without accounting for this context produces misleading comparisons.
Reading the Patterns That Matter
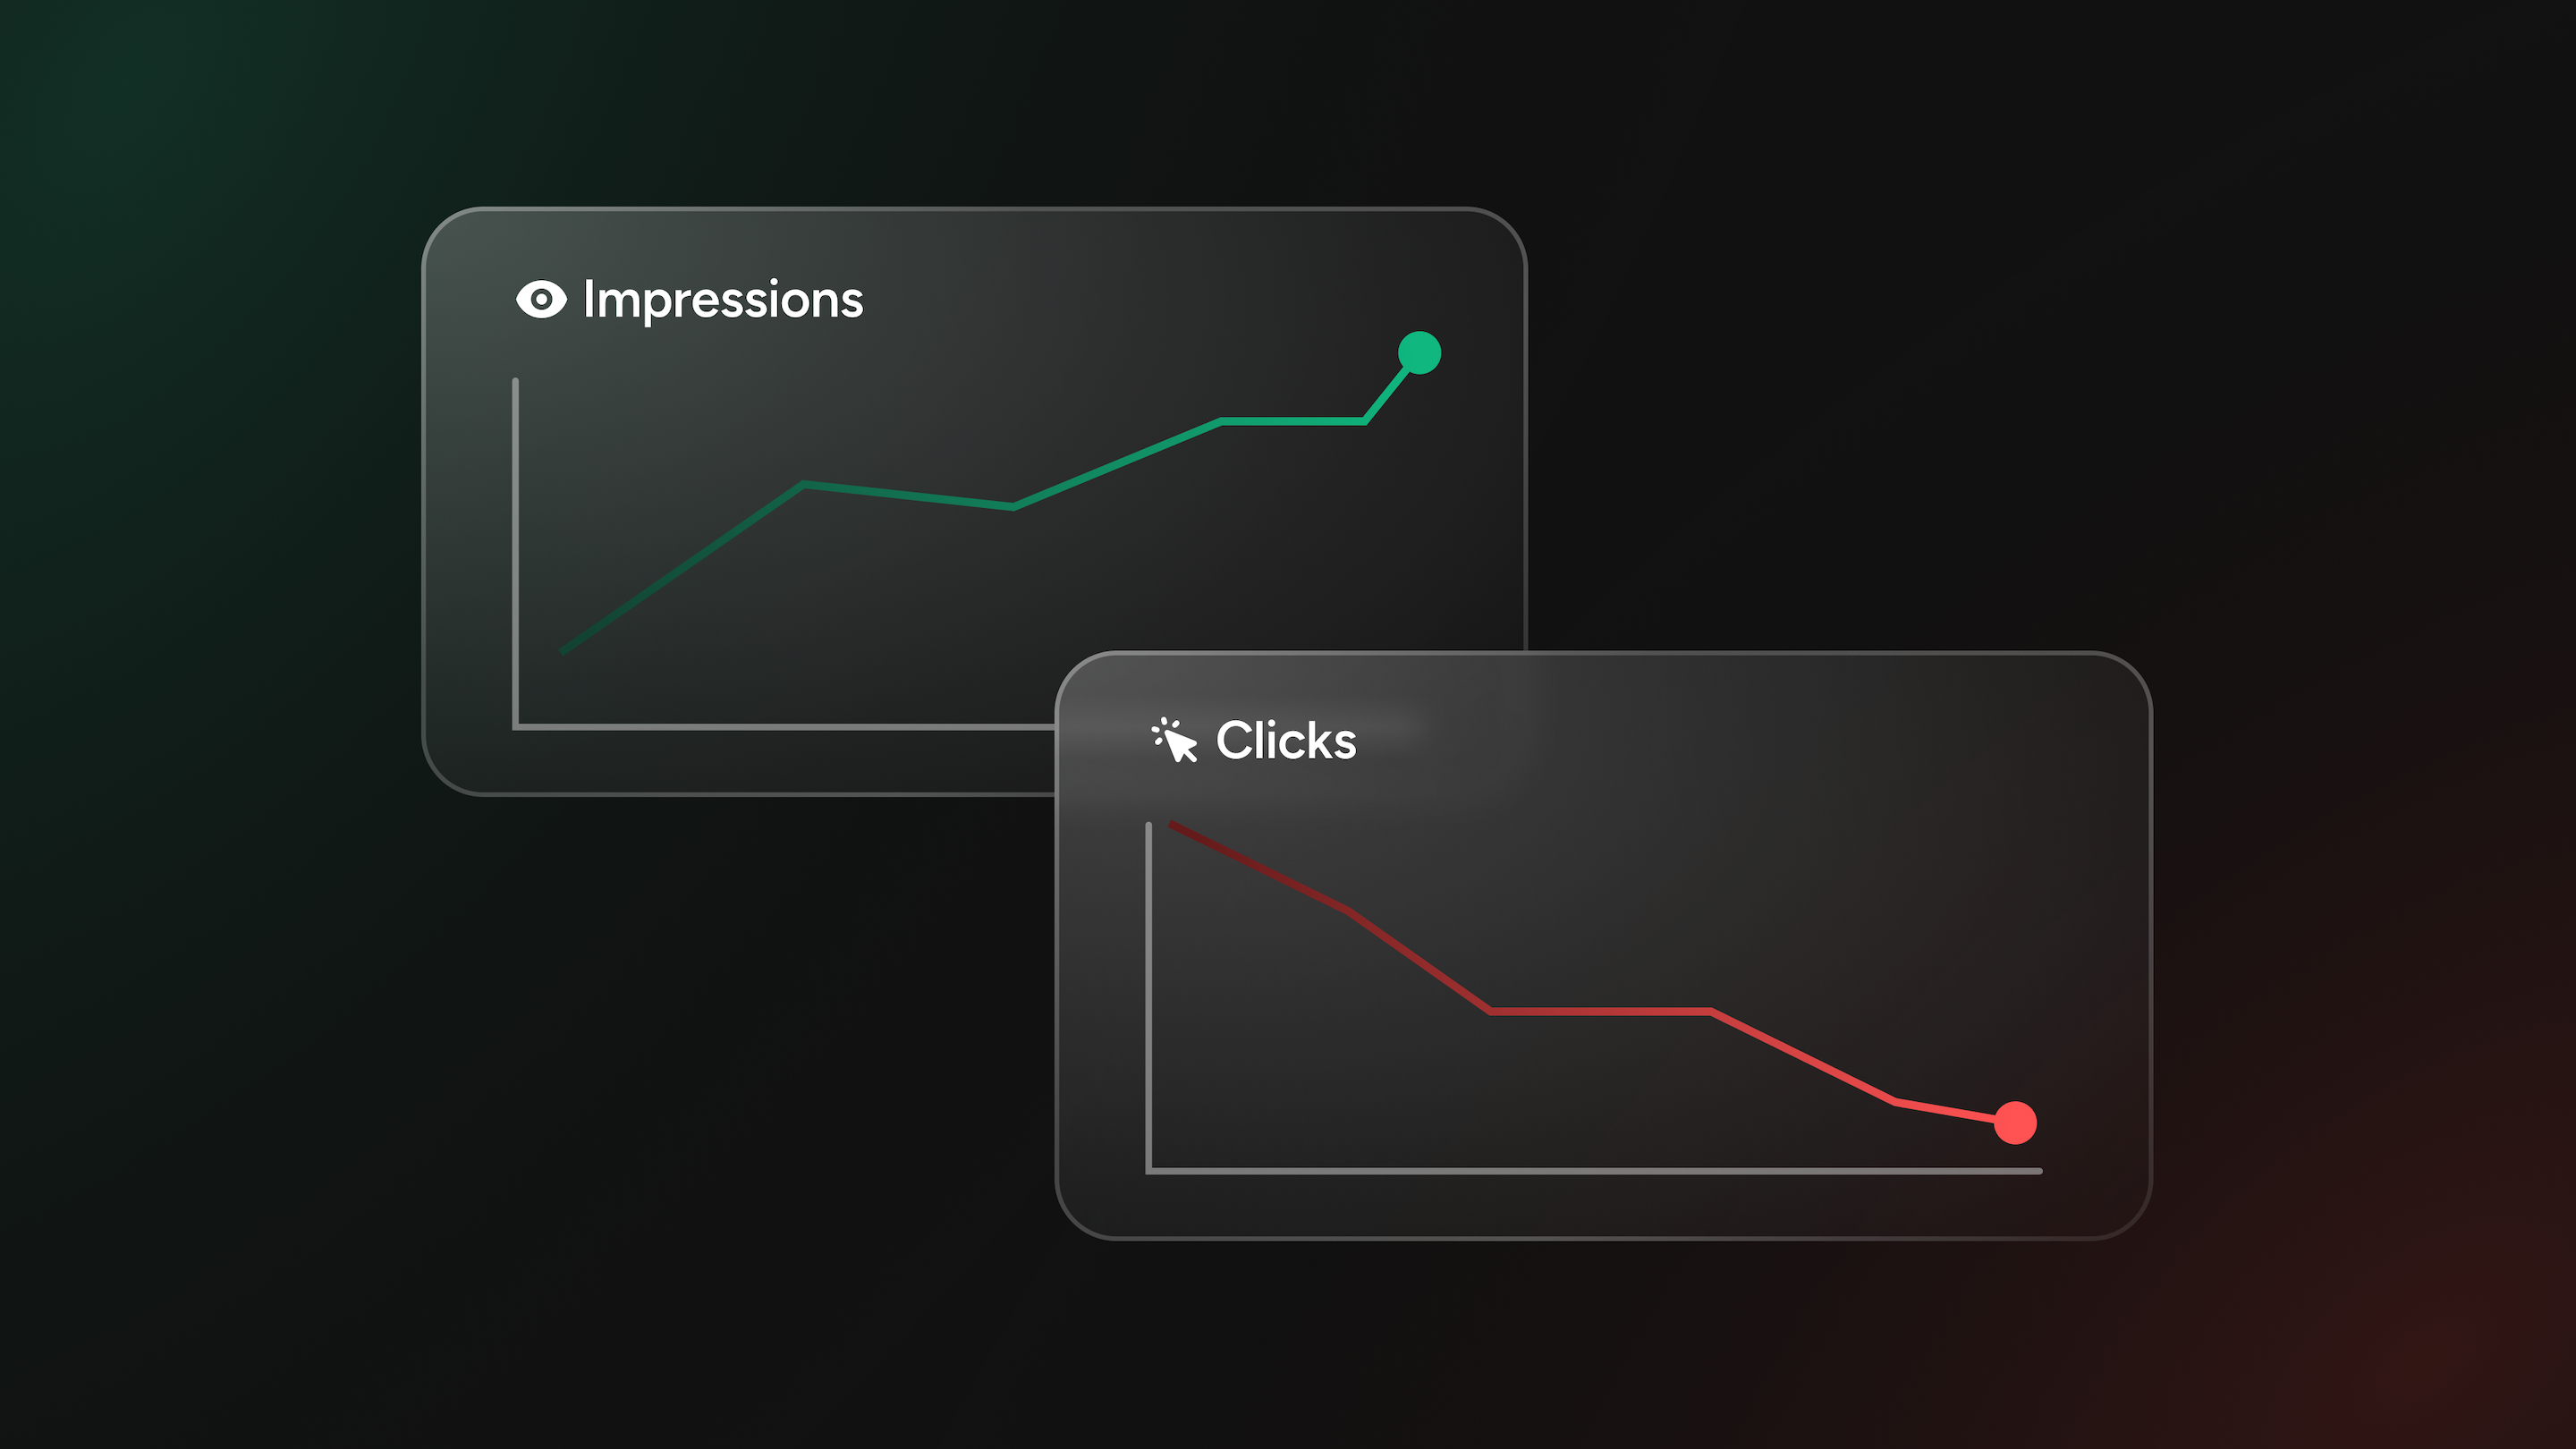
High impressions, low clicks
This is the most common pattern in livestream product data and the one most frequently misread as underperformance. Before drawing conclusions, there are two distinct causes to separate.
The first is a placement timing problem. If impressions are high because a product was pinned early in the stream, before the audience was engaged and the content had established its rhythm, viewers saw the product but were not yet in a state of engaged attention. A product surfaced in the first two minutes of a stream, when viewers are still orienting to the content, will almost always generate weaker click behavior than the same product surfaced at a moment of high energy and relevance mid-stream.
The second is a product-to-content mismatch. When a pinned product has no visible connection to what is happening on screen, viewers process it as background noise rather than relevant information. High impressions with low clicks in this scenario is not an interest problem. It is a placement problem. The product was seen but not in a context that gave viewers a reason to engage with it.
Distinguishing between these two causes requires looking at the timestamp of the high-impression moment. Was the product pinned during an engaged segment of the stream, or during a lower-energy transition? The answer tells you whether to adjust timing, product selection, or both.
Low impressions, high clicks
This pattern is less common but highly informative. It typically means a product was surfaced to a smaller audience, either during a lower-viewership segment of the stream or for a shorter window, and the viewers who did see it engaged with it at a strong rate.
This is a signal worth acting on. A product that generates strong click behavior among the viewers who encounter it is telling you something specific about that product's relevance to your audience. The strategic response is to surface that product earlier in the stream, when the audience is larger, or to feature it more prominently in future streams rather than treating it as a secondary item.
Consistent clicks across multiple products
When several products in a stream generate similar click rates, it usually indicates a well-structured stream where product moments were distributed intentionally throughout the broadcast rather than concentrated in one segment. This pattern is a healthy sign that the product layer is integrated into the content rather than layered on top of it.
The next question this pattern raises is which product categories or types drove the strongest engagement. Even when overall click rates are similar, the products that generated the most interest relative to their position in the stream tell you about your audience's priorities. That information should directly influence which products get pinned first in the next stream.
Live Analytics vs. Replay Analytics: Two Different Audiences
One of the most practically important distinctions in livestream product data is the difference between what live viewers and replay viewers tell you. They are not the same audience, and treating their data as equivalent produces incomplete conclusions.
Live viewers are in the moment. They are watching something happen right now, with the energy and unpredictability that comes with it. A live viewer who clicks on a product during a stream is acting on an impulse generated by the live experience. They are engaged with the content and the product appeared at the right moment within that engagement.
Replay viewers are researching. A viewer who watches a stream after it has ended is typically there because they knew or heard about the content and wanted to see it on their own schedule. Engagement decays significantly once the urgency of the live moment is gone, but the viewers who do engage with a replay are often doing so with a higher level of deliberate intent. They sought the content out. They are more likely to pause, browse, and engage with product information at their own pace.
What this means in practice: clicks that occur during the live broadcast are high-intent, moment-driven signals. Clicks that occur during replay are deliberate, research-driven signals. Both matter, but they tell you different things and warrant different responses.
A product that generates strong clicks during the live stream but low replay clicks may have benefited from the energy and urgency of the live moment. A product that generates stronger clicks during replay than during the live stream may be one that viewers needed time to consider, or one that was surfaced at a lower-energy moment in the live broadcast.
- On configuring your product list for replay: Because replay viewers engage differently than live viewers, it is worth reviewing your product list after the stream ends and before the replay is widely accessible. Products that performed strongly during the live broadcast should remain prominent. Products that were pinned for live timing reasons but have weaker contextual relevance for a viewer watching on demand can be deprioritized. The replay audience benefits from a cleaner, more deliberate product presentation than the live broadcast requires.
Using the Data to Improve the Next Stream
Product data from a single stream is a starting point. The patterns that become strategically useful emerge across multiple streams, when you can see which variables consistently produce stronger engagement and which ones consistently underperform.
- Track which position in the stream produces the strongest click behavior. If products featured in the middle third of your streams consistently outperform those featured at the opening or closing, that pattern should shape when you schedule your most important product moments. The stream's peak-engagement window is your highest-value product placement window.
- Note which product types generate the most deliberate engagement. Over several streams, it becomes clear whether your audience responds more to products being actively demonstrated, products mentioned verbally and then pinned, or products that appear in the context of a question from the audience. Each of these is a different kind of product moment, and the one that consistently produces stronger clicks is the model to replicate.
- Compare impression volume across streams against your viewer retention data. If a stream with higher overall viewership produced weaker product impressions than a smaller-audience stream, the difference may be in how the product moments were structured, not in the audience size. A smaller, more engaged audience that is present for the product moments produces better data than a larger audience that drops off before those moments arrive.
- Watch for replay click patterns that diverge from live patterns. When a product generates significantly more engagement in replay than it did during the live stream, it is worth understanding why. Was it surfaced at a low-energy moment during the live broadcast? Did the host spend more time on it in a segment that replay viewers seek out? That divergence is a useful signal for live planning as much as for replay configuration.
The Feedback Loop Worth Building
Every stream with tagged products is a data point. Every data point narrows the gap between intuition and evidence about what your specific audience responds to, in what format, at what moment in a live experience.
The teams that improve most consistently with this data are not the ones running the most streams. They are the ones reviewing product data immediately after each broadcast, making one specific adjustment for the next stream based on what they observed, and tracking whether that adjustment produced the expected result.
Product impressions and CTA clicks are the numbers. The question those numbers answer is: what does this audience respond to when they encounter a product during a live experience? That question is worth asking deliberately after every stream, and the data makes the answer available every time.