
How to Ask Better Questions About Your First-Party Data
The connector is live. The data is accessible. But the difference between a number you glance at and a number you act on comes down to how you asked for it.
Most teams start with broad questions. "How are we doing?" "What's our engagement like?" The answers come back just as broad: a number with no comparison point, a trend with no context, a metric with no direction attached to it.
The fix is not asking less. It is asking with more structure. A question that names a timeframe, specifies a comparison, and signals what the answer is for returns something you can take into a meeting, a brief, or a decision. The data is the same either way. The difference is in how precisely you reach into it.
What your first-party data actually covers
Before sharpening the question, it helps to know the shape of what you are asking. First-party data generated inside your app spans several layers, and each one answers a different kind of question.
User activity covers the actions your users take: posts created, comments left, reactions given, follows, content shared. This is the behavioral foundation. It tells you not just how many users are active, but what "active" looks like in your app.
Content performance tracks how individual pieces of content land: engagement volume, reach, format-level comparisons, and how performance shifts over time. It answers what is working, not just what exists.
Audience segments group users by behavior pattern, not just demographic. Contribution scores, activity levels, engagement frequency, and cohort membership reveal who your most valuable users are, how new users differ from long-tenured ones, and where behavior is changing.
Sentiment and conversation trends surface what users are talking about, which topics are gaining momentum, and where sentiment is shifting. This is qualitative signal expressed as structured data.
Growth metrics cover the trajectory: new signups, retention after first week, active user counts over time, and quarter-over-quarter comparisons.
Each layer can be queried on its own or combined. A question about "top-performing content" pulls from content performance. A question about "which segments engage with top content" combines content performance with audience segments. Knowing what the layers are helps you ask questions that reach across them.
The anatomy of a question that works
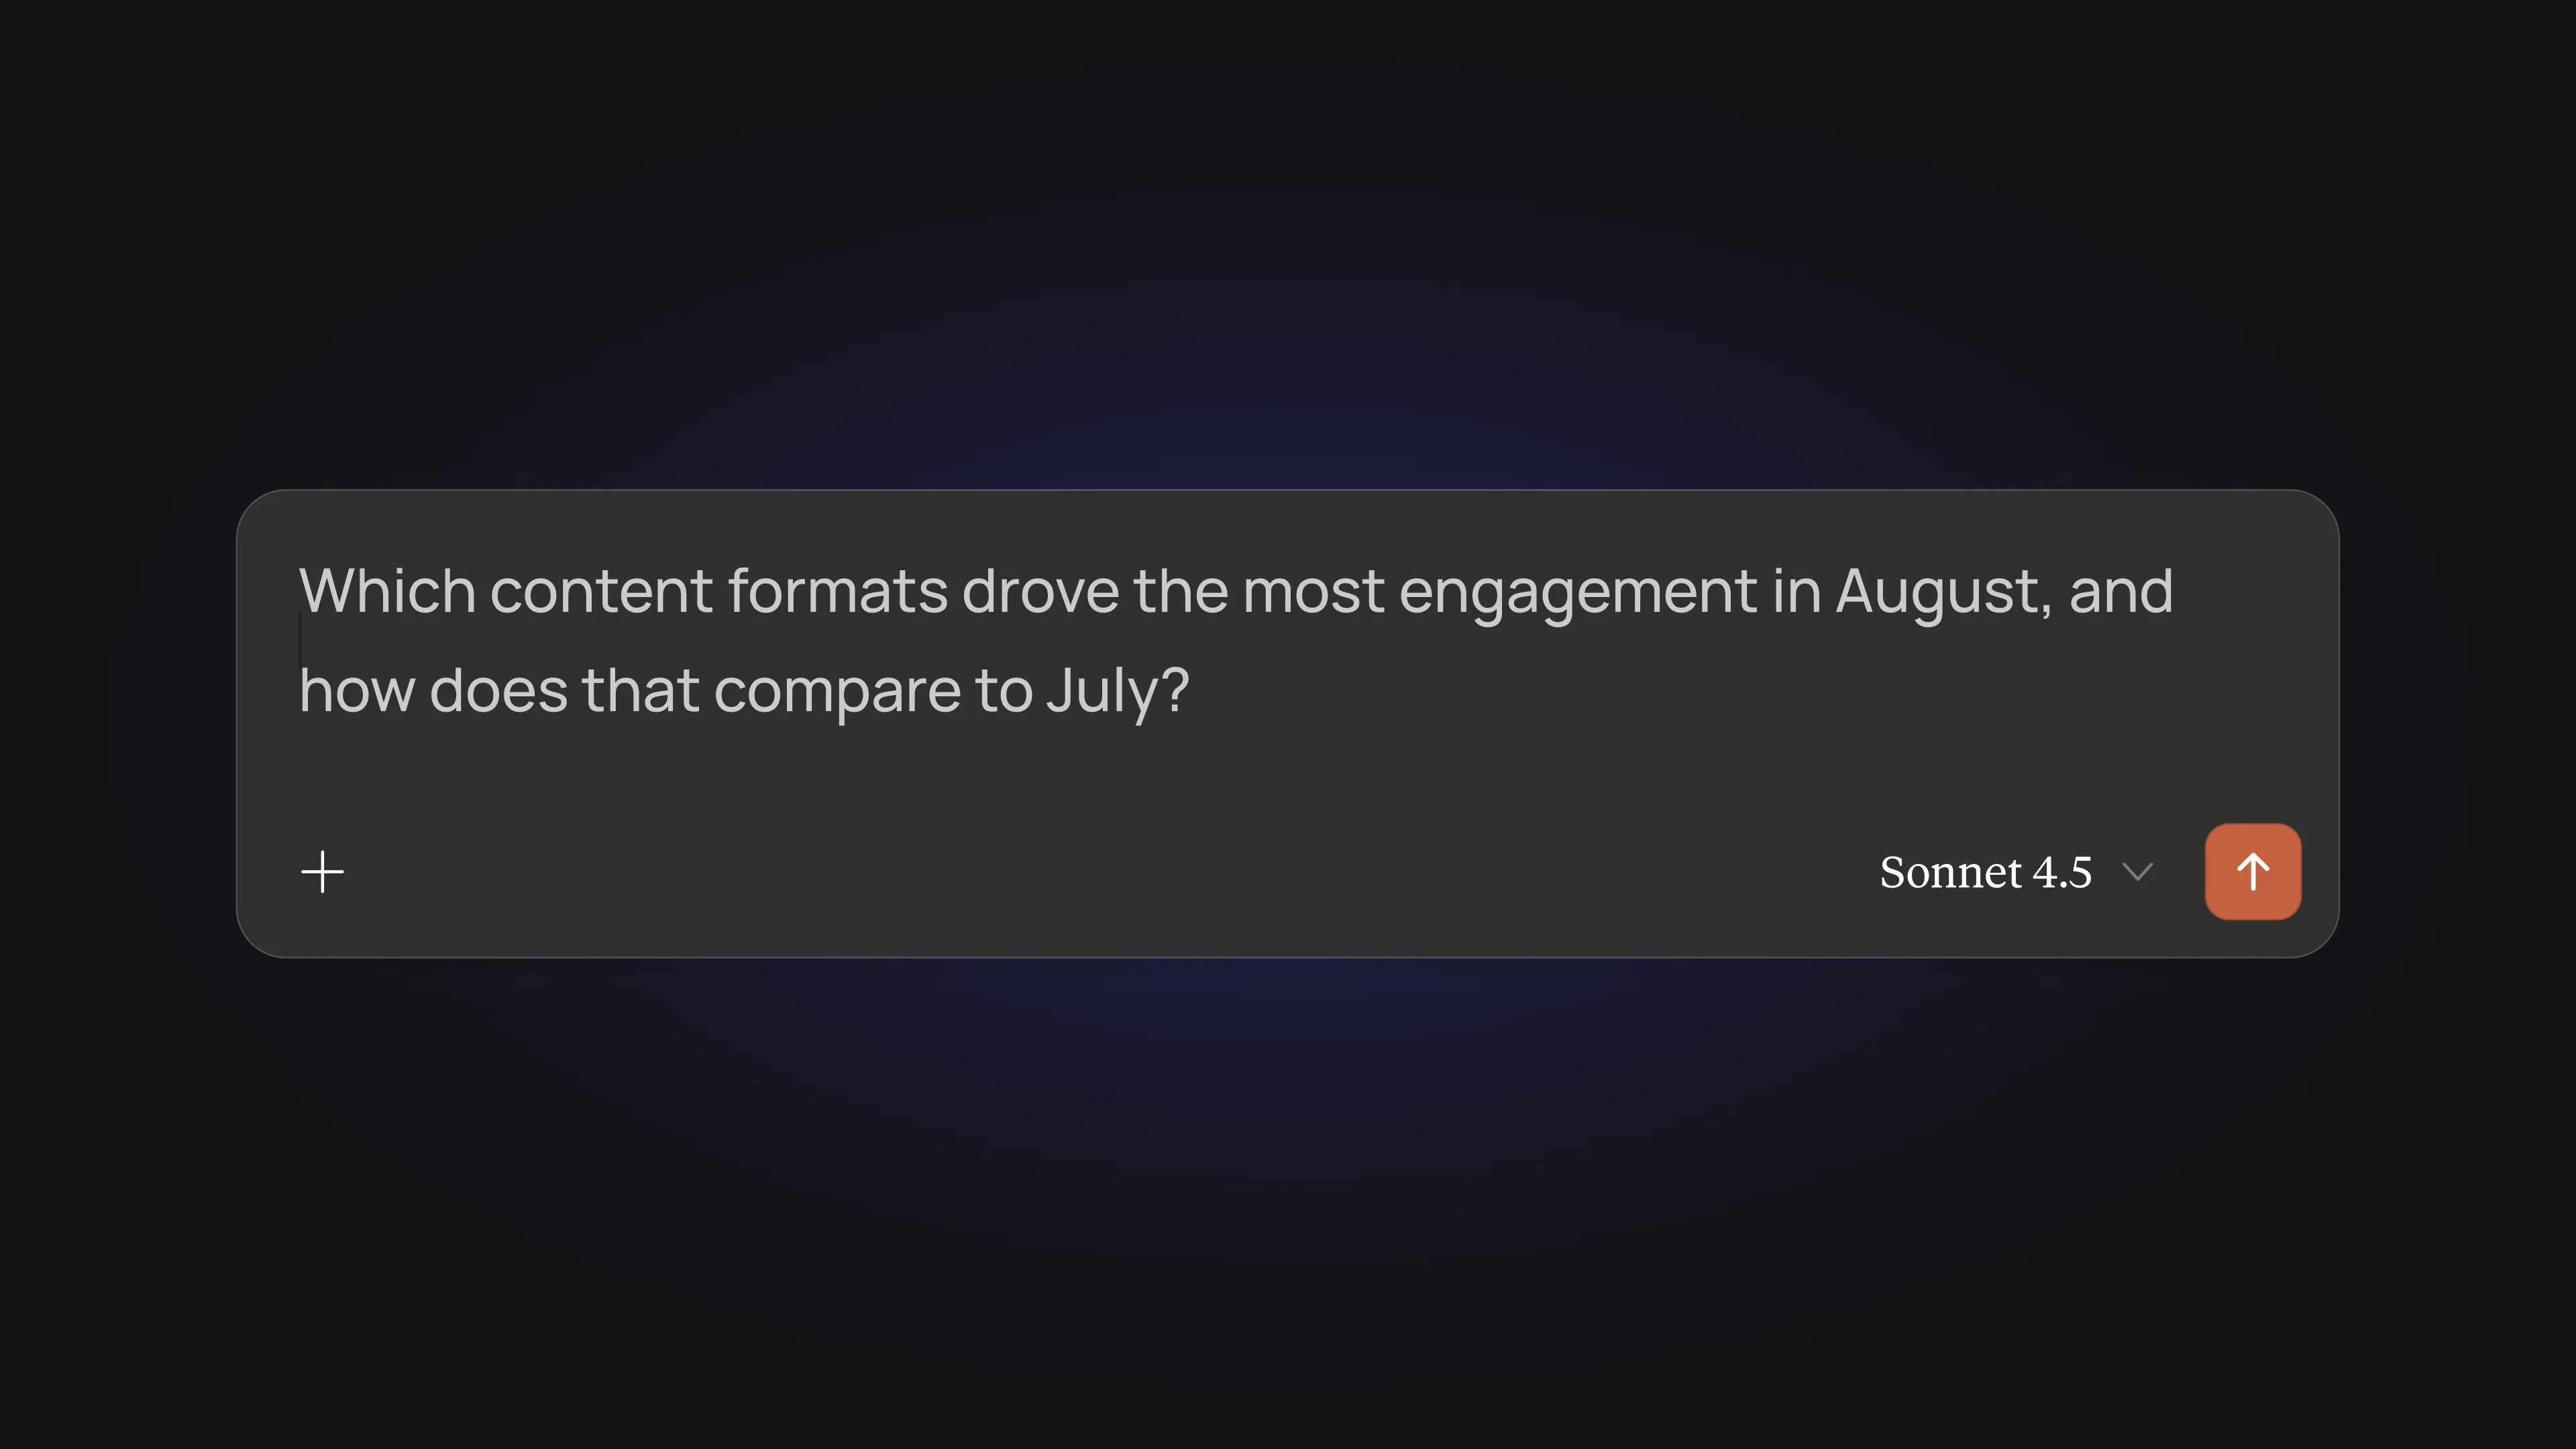
Three elements separate a useful query from a vague one: specificity, context, and intent.
Specificity means naming what you want measured. "How is engagement?" could mean impressions, reactions, comments, active users, or session duration. "How many unique users posted or commented in the last 30 days?" names the metric.
Context means giving the question a frame of reference. A number on its own does not tell you whether it is good or bad. A comparison does. "How does this month compare to last month?" or "How did behavior change after the feature launch on September 1?" gives the answer something to stand against.
Intent means signaling what the answer is for. "I'm preparing a campaign brief and need to know which formats performed best last quarter" does two things: it sharpens the query toward format-level performance data, and it tells the AI assistant that the answer should be shaped for a brief, not a board presentation.
Here is the difference in practice:
- Vague: "What content is doing well?"
- Sharp: "Which content formats drove the most engagement in August, and how does that compare to July? I'm planning next quarter's content calendar."
The vague version returns a generic list. The sharp version returns a format comparison with a time dimension and enough structure to inform a planning decision.
Follow-up questions that turn a number into a narrative
A single answer is a data point. A conversation builds context around it.
The most useful pattern is to start with a broad-but-specific question, then narrow. Ask for the headline number first. Then ask who is driving it. Then ask how it compares to a previous period or a different segment.
A realistic exchange:
First question: "What were our most engaged content formats last month?" The answer returns rankings by format with engagement volume.
Follow-up: "Break that down by user segment. Are new users and power users engaging with the same formats?" The answer reveals that new users over-index on polls and questions while power users drive discussion threads.
Follow-up: "How does that compare to three months ago? Has the split between segments changed?" The answer shows whether the pattern is stable or shifting.
Three turns. You went from a content performance ranking to a segmented behavioral trend with a time dimension. That is not a number for a dashboard. That is an insight for a strategy conversation.
Reading the methodology behind the answer
Every answer explains how it was calculated. This is not a footnote to skip. It is the part that makes the number trustworthy in a room full of people who will ask how you got it.
Look for three things in the methodology:
- Definitions. How was "active" defined? Does "engagement" mean reactions only, or does it include views? The definition determines what the number actually measures. Two people asking "how many active users do we have" can get different numbers if the definition differs. The methodology makes it explicit.
- Date ranges. A "last month" query could mean calendar month or rolling 30 days. The methodology tells you which one was used, and whether the comparison period matches.
- Segmentation logic. When the answer breaks data down by segment, the methodology explains how users were grouped. Contribution score thresholds, activity-level bands, and cohort membership dates all shape the boundaries. Knowing how users were grouped tells you how much to trust the split.
When you present a number in a meeting and someone asks "how was that calculated," the methodology is your answer. Quoting it directly is faster and more credible than reconstructing the logic from memory.
Start with the question you already have
The best way to learn what your first-party data can tell you is to start with a question you are already carrying. The campaign brief you are writing, the QBR you are preparing for, the content calendar decision you have been putting off because the data was in another tool.
Ask it the way you would ask a colleague. Then follow up. Then sharpen. Every round teaches you something about what the data contains and how to reach it more precisely next time.
The connector is available now through social.plus. Connect on Claude. Connect on ChatGPT. Read the documentation.