
Five Questions Every Team Should Ask Their Data
Every team asks different questions about user behavior. A marketer evaluating last month's campaign needs different data than a product lead measuring a feature launch. Making first-party data conversational means each team gets the answer shaped for their context, not a dashboard designed for someone else's workflow.
The gap between having first-party data and using it well is not technical. It is contextual. The data is the same for everyone. What changes is the question each team brings to it, what a useful answer looks like for their workflow, and what they do with that answer once they have it.
Most dashboards are built for one team's view. The growth team sees acquisition funnels. The content team sees performance tables. The executive sees a summary. Each view is useful, but none of them answers the specific question someone has at 2 PM on a Wednesday when they need a number for a brief, a meeting, or a decision they are making right now.
What follows are the five questions that come up most often across teams, why each one matters, and what to do with the answer.
Campaign intelligence: what the marketer needs to know
A marketer preparing a campaign brief needs two things from first-party data: what worked last time, and who responded. Without both, the next campaign is built on instinct rather than evidence.
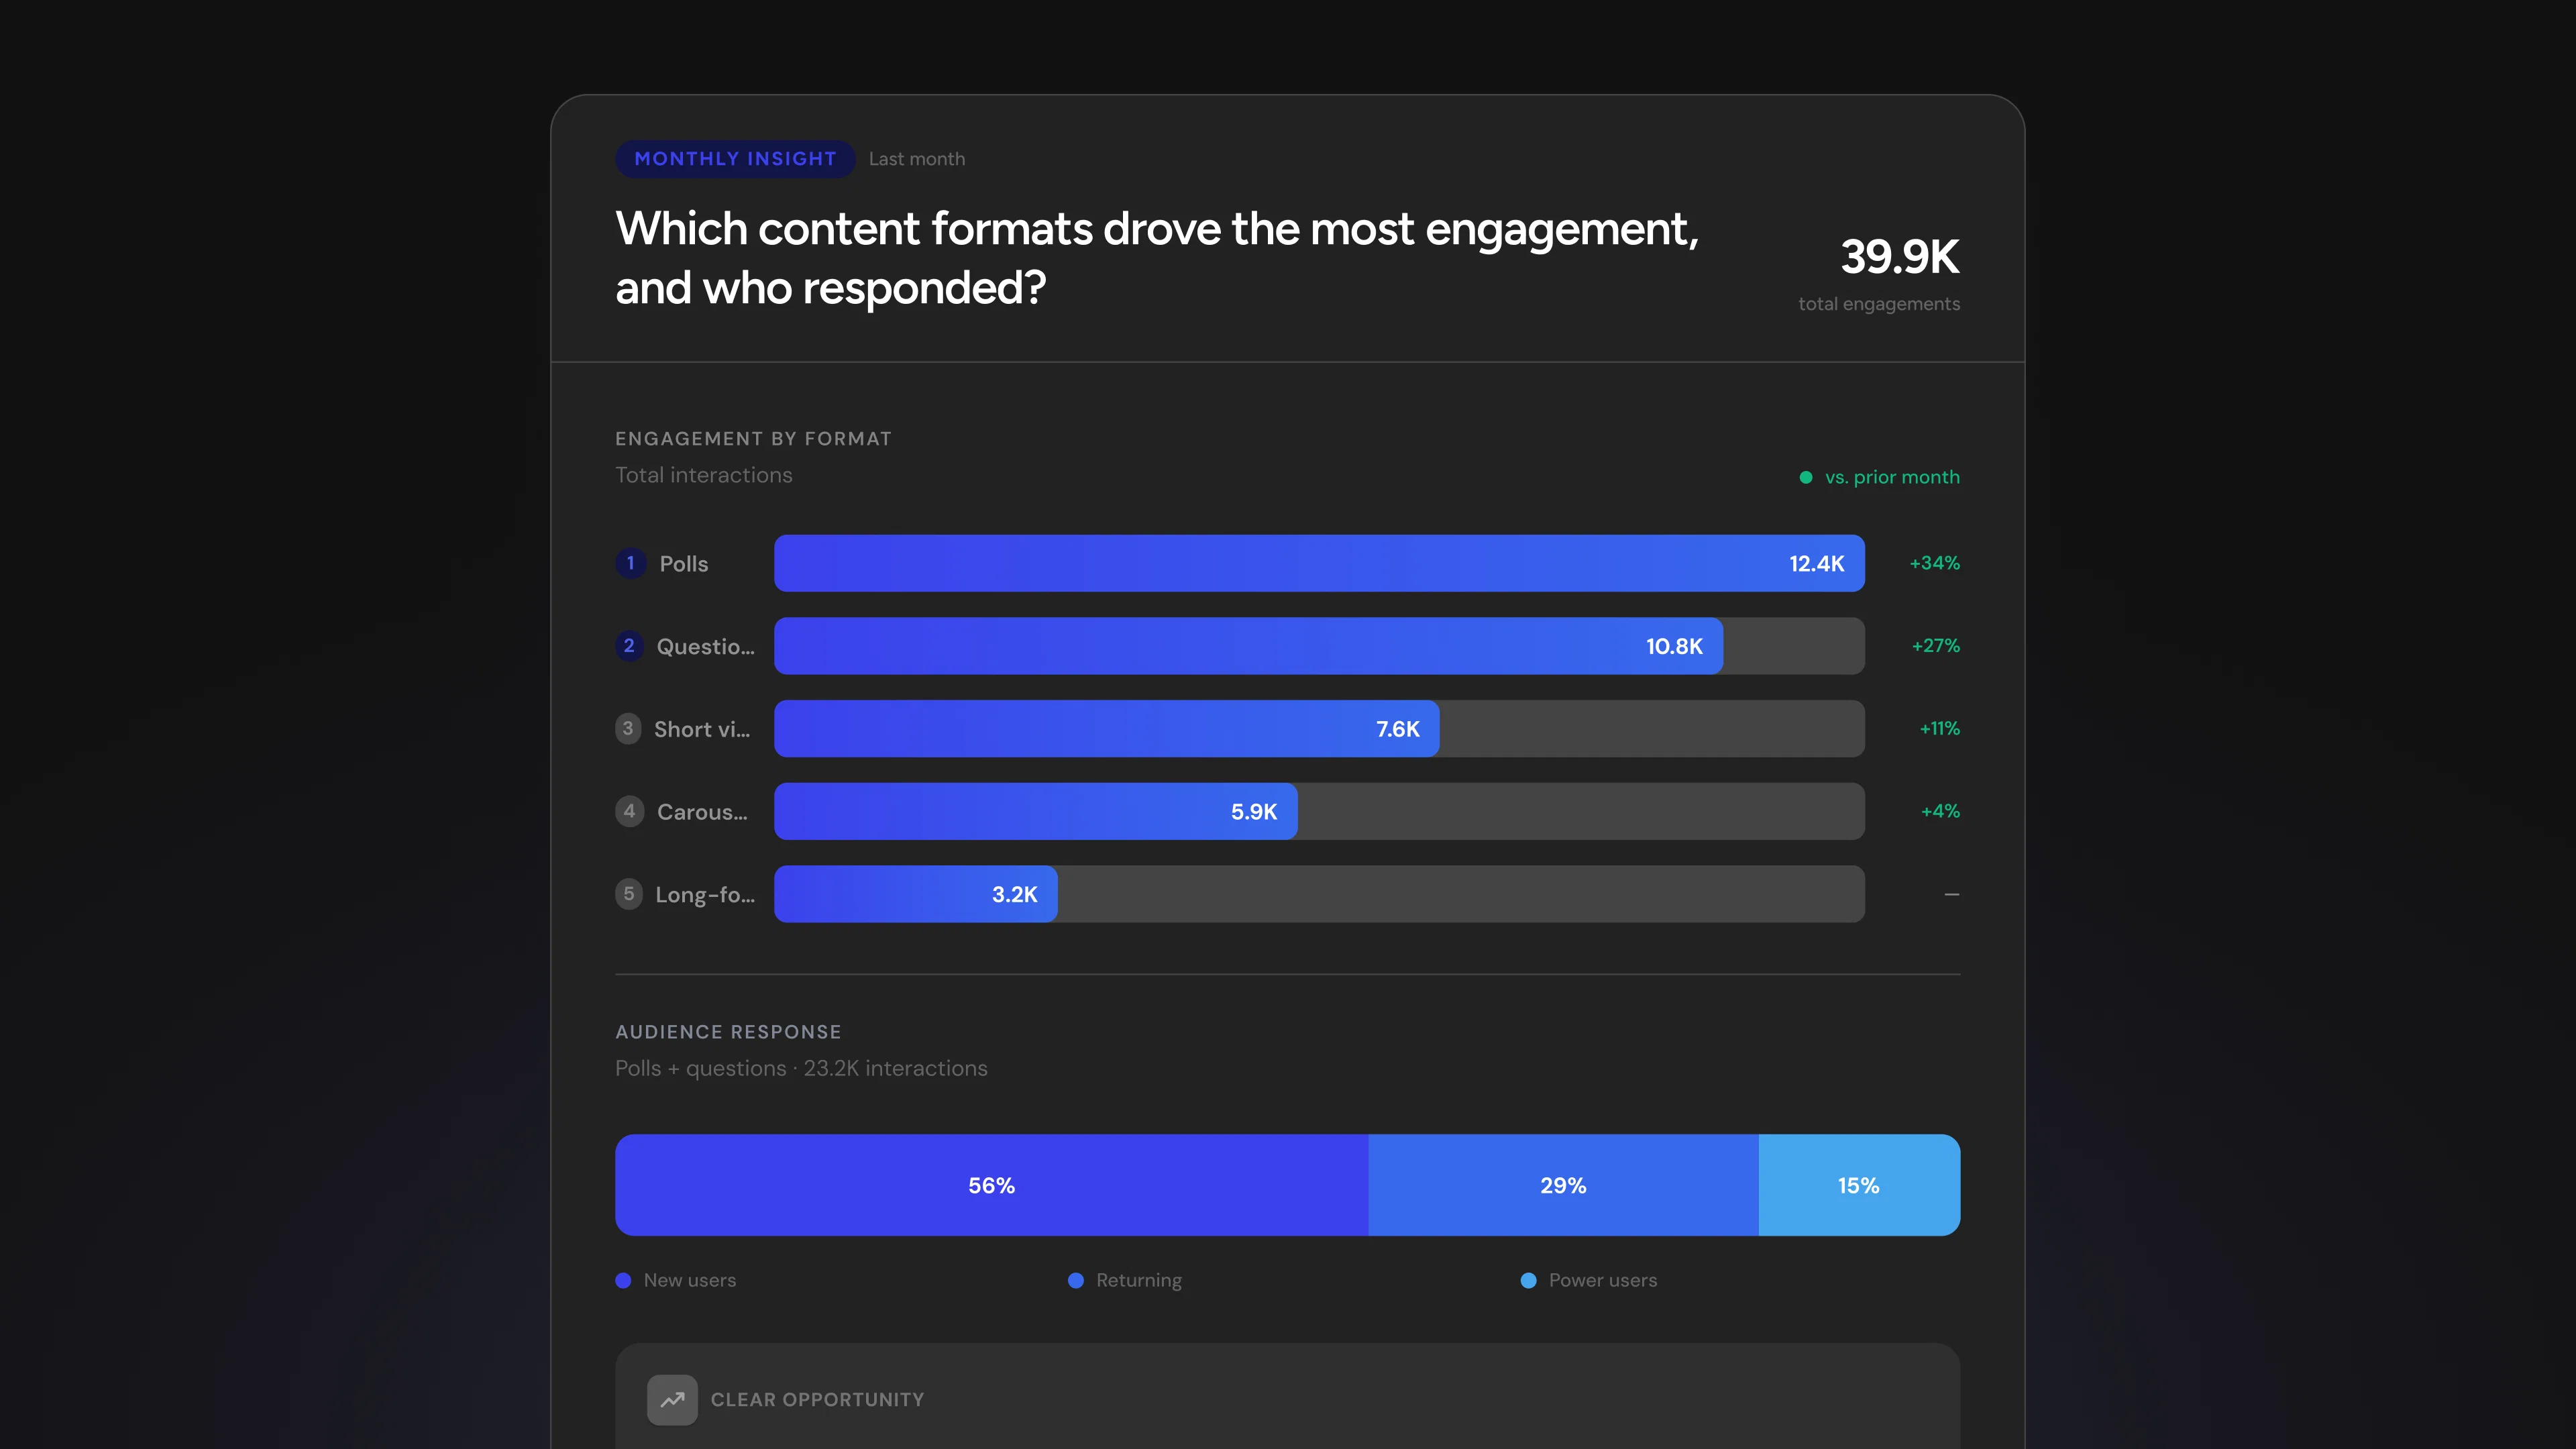
A strong starting question: "Which content formats drove the most engagement last month, and which user segments responded the most?"
The answer returns a format-level ranking with engagement volume, and a segment breakdown showing where the response concentrated. If polls and questions outperformed long-form posts, and new users drove most of the engagement on those formats, the next campaign has a clearer target: short, interactive formats aimed at newer audiences.
The follow-up that sharpens it: "How does that compare to the previous quarter? Is this a recent shift or a stable pattern?" Knowing whether a trend is new or established changes whether you bet on it or test it. A one-month spike in poll engagement is an experiment. Three months of it is a strategy.
Feature impact: what the product lead needs to know
After a feature ships, the product lead's question is not whether people noticed. It is whether behavior changed. That means a before-and-after comparison with enough specificity to isolate the feature's effect from normal fluctuation.
A strong starting question: "We launched [feature] on [date]. How did user activity change in the week after compared to the week before?"
The answer returns activity volume, engagement type breakdown, and a period comparison. What you are looking for is not just a lift in a number. You are looking for a change in the pattern: did users start doing something they were not doing before, or did they do the same things more frequently? A feature that shifts behavior is a different signal from one that amplifies existing behavior, and the product roadmap responds differently to each.
The follow-up: "Break that down by user segment. Did new users and existing users respond differently?" Feature adoption that skews toward power users suggests a depth play. Adoption that reaches new users suggests the feature is lowering the barrier to engagement. The next investment depends on which one it is.
Audience growth: what the growth lead needs to know
Growth teams track acquisition numbers, but the more useful question is about the shape of growth: which segments are expanding, what those users have in common, and whether new cohorts are retaining at a rate that justifies the acquisition cost.
A strong starting question: "Which user segments grew the most this quarter, and how does their engagement compare to the segments that did not grow?"
The answer returns segment-level growth rates alongside engagement metrics for each segment. Growth in a segment that also shows high engagement is a compounding signal. Growth in a segment with low engagement is an onboarding problem waiting to surface in next quarter's retention numbers.
The follow-up: "For the fastest-growing segment, what does their first-week behavior look like compared to users who joined six months ago?" This isolates whether onboarding is improving or whether the audience composition is shifting. Both are worth knowing. They lead to different actions.
Trendspotting: what the content strategist needs to know
Dashboards show you what happened. Conversation trends show you what is happening now. The content strategist's advantage with first-party data is the ability to see what users are talking about this week and where sentiment is moving, before it shows up as a change in a performance metric.
A strong starting question: "What are the trending topics in our app this week? Are there any notable shifts compared to the previous few weeks?"
The answer returns topic rankings by conversation volume, with sentiment indicators and momentum signals showing which topics are rising. A topic that is growing in volume and shifting in sentiment is a signal worth acting on: whether that means a blog post, a community response, or a campaign angle depends on what the sentiment shift looks like.
The follow-up: "Which user segments are driving the conversation on the top trending topic?" Knowing whether a trend is broad-based or concentrated in one cohort determines whether it is a content opportunity for everyone or a targeted response for a specific audience.
Executive readiness: what leadership needs before the meeting
An executive walking into a business review needs a snapshot that covers multiple dimensions in one view: growth trajectory, active user health, and content performance, with a quarter-over-quarter comparison already built in. The usual path to this involves pulling from several dashboards, asking someone on the analytics team, and hoping the numbers are current.
A strong starting question: "Give me a snapshot of the last 90 days: growth trends, active users, retention, and top-performing content, compared to the previous quarter."
The answer returns a multi-metric summary with comparisons. The value is not just the numbers. It is that the methodology for each metric is explained alongside the data, so when someone in the meeting asks "how are we defining active users" or "is that calendar quarter or rolling 90 days," the answer is already on hand. The methodology turns a number you are presenting into a number you can defend.
The follow-up: "What drove the biggest change between the two quarters?" This moves the conversation from reporting to diagnosis, which is where the board-level discussion actually lives.
Start with your team's question
Every one of these questions starts from a real workflow: a brief, a launch review, a growth audit, a content calendar, a board meeting. The common thread is that each team's question is different, and each answer is grounded in the same first-party data, shaped for the context of whoever is asking.
Pick the question your team already has and ask it.
social.plus Agentry is available now. Connect on Claude. Read the documentation.