Most teams use post analytics to look backward. They check how a post performed, note whether the numbers were good or bad, and move on to the next piece of content. The comparison tool in Content Performance is built for something more useful than that: figuring out what specific decisions about format, topic, and timing are driving the results you are getting.
The difference is the direction you are facing. Reviewing posts one at a time tells you what happened. Comparing posts side by side, with the right combination of posts and a clear question going in, tells you what to do next.
This guide walks through how to use the comparison tool in a way that produces a concrete decision at the end, not just an interesting observation.
Step 1: Start With a Question, Not a Post
The most common way teams misuse a comparison tool is opening it without a specific hypothesis and selecting posts at random, usually the four most recent, or the four with the highest view counts. The result is data without direction. Numbers that look different but do not clearly tell you why.
A useful comparison starts with a single question you are genuinely trying to answer. Here are the questions worth asking:
- Does one format consistently outperform another? If you publish both video and image posts, pick two video posts and two image posts on similar topics and compare them. You are not looking for a winner in this specific sample. You are looking for a consistent pattern in how reach, impressions, and engagement behave across formats.
- Does topic category affect how long a post stays active? Promotional content and educational content often have very different engagement lifecycles. A promotional post tends to spike early and fade within 24 to 48 hours. An educational post may build more slowly but hold engagement for longer. Comparing posts across these two categories surfaces that pattern directly.
- Does publish timing change how widely content distributes? Compare two posts with nearly identical content published at different times or on different days. The reach and impressions data will show you whether timing is affecting distribution in a meaningful way, or whether your content performance is relatively consistent regardless of when you post.
- Is a recent campaign working better or worse than a previous one? Select representative posts from two different campaign periods and compare them directly. This strips away the noise of aggregate reporting and shows you the per-post reality.
One question per comparison. The clearer the question, the more useful the answer.
Step 2: Select Your Four Posts Deliberately
Content Performance lets you compare up to four posts at once. How you fill those four slots determines whether you get signal or noise.
Control as many variables as you can. If you are comparing formats, keep the topic consistent. The more variables you change between posts, the harder it becomes to isolate what is actually driving the difference. This is the same logic behind any controlled experiment: change one thing at a time.
Use the date range filter intentionally. For most format and topic comparisons, pulling from the same 30 to 90 day window keeps the competitive context similar. Comparing a post from last week to one from eight months ago introduces too many external variables, algorithm changes, seasonal audience behavior, and platform shifts, to produce a clean read.
Do not default to your highest performers. It is tempting to fill the comparison with your best posts. The problem is that this tells you what your ceiling looks like, not what patterns are repeatable. A more instructive comparison often includes one strong performer, one average performer, and two posts that surprised you in either direction. The outliers are where the most useful information hides.
Worth knowing: The half-life of a social media post varies significantly by platform and format. Most posts receive the majority of their total engagement within the first 24 to 48 hours, which means posts you are comparing should ideally be at least a few days old so you are working with a complete picture rather than a snapshot of early momentum.
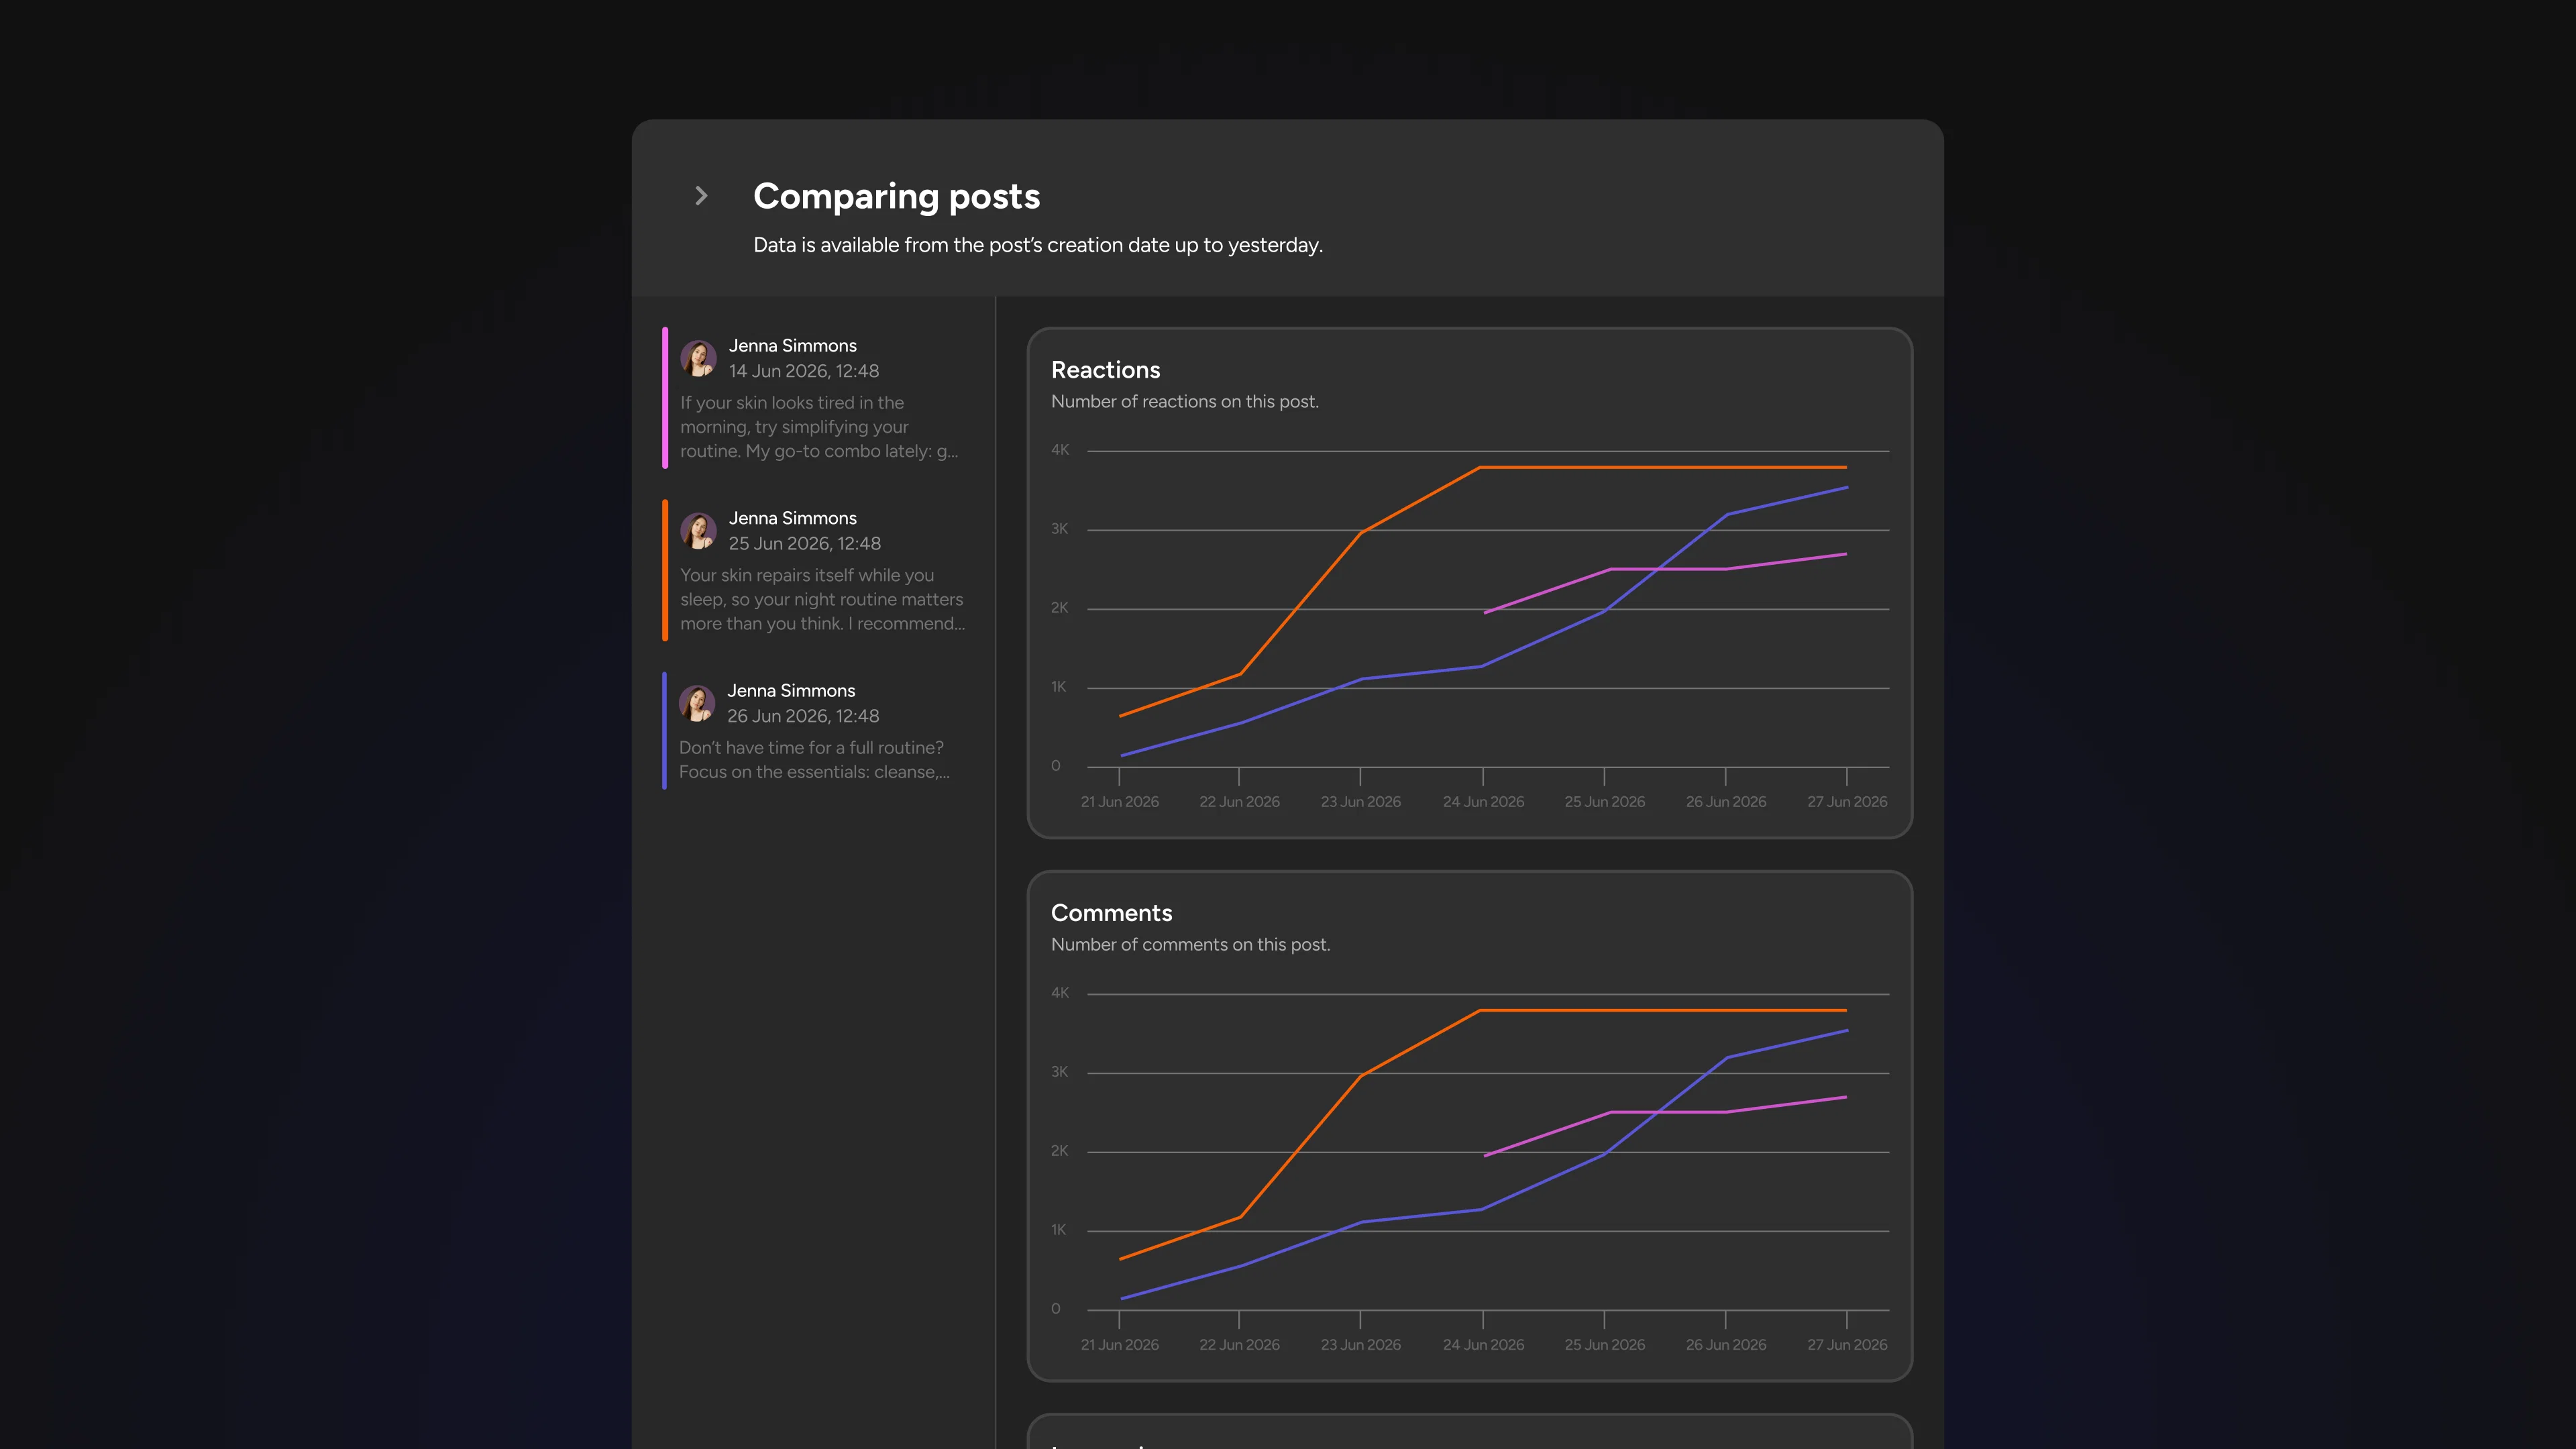
Step 3: Read Reach and Impressions Together, Not Separately
When you pull up a side-by-side comparison, resist the urge to scan for the biggest number and declare a winner. The most useful information is in the relationship between reach and impressions, not in either metric alone.
Reach counts the number of unique people who saw your post. It tells you how widely your content is distributed.
Impressions count the total number of times your post was displayed, including multiple views by the same person. It tells you how often your content appeared in front of people.
A post where impressions are significantly higher than reach means the same people are seeing it repeatedly. That can signal genuine interest from a loyal core audience, or it can signal that the content is failing to reach new people outside that core. Context tells you which.
A post where reach is high but impressions are only modestly higher means your content is distributed broadly but does not pull people back for a second look. That is a reach story, not a resonance story. Good for top-of-funnel awareness. Less useful if your goal is building an engaged community.
The most valuable comparison pattern to look for is the post where both reach and impressions grew together across the measurement window. That combination, wide distribution and repeated engagement from the people who found it, is the signature of content that genuinely connected with its audience.
Step 4: Use the Daily Breakdown to Read the Lifecycle, Not Just the Total
The daily engagement breakdown is where the comparison tool moves from descriptive to diagnostic. Total numbers tell you what happened. The day-by-day view tells you how it happened, and that distinction changes what you do next.
Spike posts versus slow-build posts. Some content drives a sharp engagement spike in the first day or two, then drops off quickly. Other posts build gradually, accumulate engagement over a longer window, and hold attention for longer. Post engagement lifecycles vary considerably by format and platform, and understanding which pattern your posts follow tells you something important about how your audience discovers and shares your content.
Spike posts are not necessarily worse than slow-build posts. They serve different strategic purposes. A spike post that generates high early reach is effective for time-sensitive announcements, campaign launches, or anything where you need broad distribution fast. A slow-build post that holds engagement for a week or longer is more valuable for evergreen content, community building, and anything where compounding visibility matters more than immediate impact.
The mistake is treating all posts as if they should follow the same pattern and measuring them all against the same timeline. The daily breakdown in a side-by-side comparison shows you immediately which of your posts are spike-driven and which are slow builds, so you can evaluate each one against the goal it was actually designed to achieve.
What to look for: In the daily breakdown, pay particular attention to days two through five after posting. A post that is still generating meaningful engagement on day four or five is signaling genuine audience interest. One that has gone flat by day two has likely exhausted its initial distribution and is unlikely to recover without additional promotion.
Step 5: Turn the Comparison Into One Concrete Decision
This is the step most teams skip, and it is the only one that makes the analysis worth doing. Every comparison session should end with a single written decision about what you will do differently in your next piece of content.
Not an observation. Not a note to investigate further. A decision.
Here is what that looks like in practice:
- You compare two video posts and two image posts on similar topics. The video posts show higher reach and a longer engagement tail on the daily breakdown. The decision: the next three posts in this content category will be video. You will revisit the comparison after those three posts to see if the pattern holds.
- You compare a post from a morning publish versus an afternoon publish. Reach is nearly identical but the afternoon post has a sharper first-day spike while the morning post has more sustained engagement across days two through four. The decision: morning publish for evergreen content, afternoon for time-sensitive announcements.
- You compare two posts from the same campaign. One has a high impressions-to-reach ratio, meaning the same people kept coming back to it. The other distributed more broadly but held less repeat attention. The decision: replicate the format and topic structure of the first post in the next campaign because depth of engagement is the priority for this audience.
The specificity of the decision matters. 'Video seems to work better' is an observation. 'The next three posts in this category will be video and we will review the comparison data in four weeks' is a decision you can act on, revisit, and learn from.
Where to Start in Content Performance
Open Content Performance and go to the post analytics view. Select four posts from the last 30 days that share at least one common variable, same format, same topic category, or same campaign. Set your date range, run the comparison, and read the reach-to-impressions ratio first, then pull up the daily breakdown for each post.
Give yourself one question going in. Come out with one decision. That is the workflow. Run it after every significant content push and the patterns that are actually driving your results will become impossible to ignore.